Posts

Showing posts from September, 2024

Activity 3.1 – Human Population

trends involving demographics are a great way to understand the challenges different countries face. In this blog, I’m going to go into the topic of  the population data of two different nations: Germany, a  developed country, and Niger, one of the least developed countries in the world. By making comparisons such as data like birth rate, life expectancy, and Gross National Income, we can see how population trends impact each country’s environment, economy, and society. Germany: A Developed Nation Birth Rate: In Germany, the birth rate is about 9 births every 1,000 people. Like many other developed nations, Germany has a low birth rate because of factors like more access to contraception, higher education, and women prioritizing careers before starting families. Death Rate: The death rate is slightly higher, being 12 deaths every 1,000 people. paired with low birth rate, this means Germany is seeing a perfectly natural population decline. This is typical for developed countrie...

Activity 2.3 – Biosphere and Interconnections

Image
   map concept 1 illustrates the flow of energy in ecosystems, including how energy is transferred between producers, consumers, and decomposers. map concept 2 shows the value of biodiversity and the factors threatening it, focusing on species interactions and ecosystem services. map concept 3 presents the biosphere’s global ecological processes, including nutrient cycles and human impacts on the environment. Each concept map illustrates a different but interconnected aspect of the biosphere. In Chapter 4, we explore how energy is the driving force behind ecosystem function. Energy flows from producers (plants and algae) to consumers (herbivores and carnivores) and eventually decomposers, sustaining life and maintaining ecosystem balance. This energy flow is crucial for understanding the dynamics described in Chapters 7 and 8. In Chapter 7, the focus shifts to biodiversity, which depends on the energy and nutrient availability in ecosystems. Biodiversity increases the resilien...

Activity 2.2.1 – My Daily Water Use

My household of 8 people water bill was Very surprising to me as I never really realized how much water we really use on a day to day its honestly very concerning as we could be conserving so much water if we would have paid more mind to are daily use. May -     24,000  gallons June-      22,500 gallons July-     25,500 gallons 24,000 + 22,500 + 25,500 = 72,000 gallons 72,000  divided by 3 = 24,000 gallons per month 24,000 divided by 8 = 3,000 gallons/person/month 3,000 divided by 30 = 100 gallons/person/day Calculator 1 Name: Hunter Water URL: Hunter Water Calculator Result: 85 gallons/day per person              Calculator 2 Name: Southwest Florida Water Mgmt District URL: SWFWMD Water Use Calculator Result: 90 gallons/day per person                                              ...

2.2 Hydrosphere/Cryosphere

Image
  As a main point of the cryosphere, glaciers affect sea levels and Earth's temperature by reflecting sunlight. However, several glaciers are receding at a startling rate as a result of climate change. to point out the effects of glacial retreat, this blog compares historical and contemporary photos of Greenland's Kangerlussuaq Glacier. The research draws attention to the threats that melting glaciers bring to freshwater supplies, coastal populations, and ecosystems. In the first photo, taken in 1984, is the Kangerlussuaq Glacier. The glacier's terminus, or termination, was now much closer to the ocean, and it spread considerably into the surrounding valley. Snowfall in the country's core compacted into ice and spread outward toward the sea, replenishing the glacier. The Greenland Ice Sheet, which covers over 80% of the island, is known for its thick and vast ice. Reference: NASA (1984). image 2 The 2020 Kangerlussuaq Glacier The second image was taken in 2020 and sho...

Module 1.1 - A Turning Point Event for Environmental Science: Celebrating the Comeback of the Burning River, 1969-2019

Image
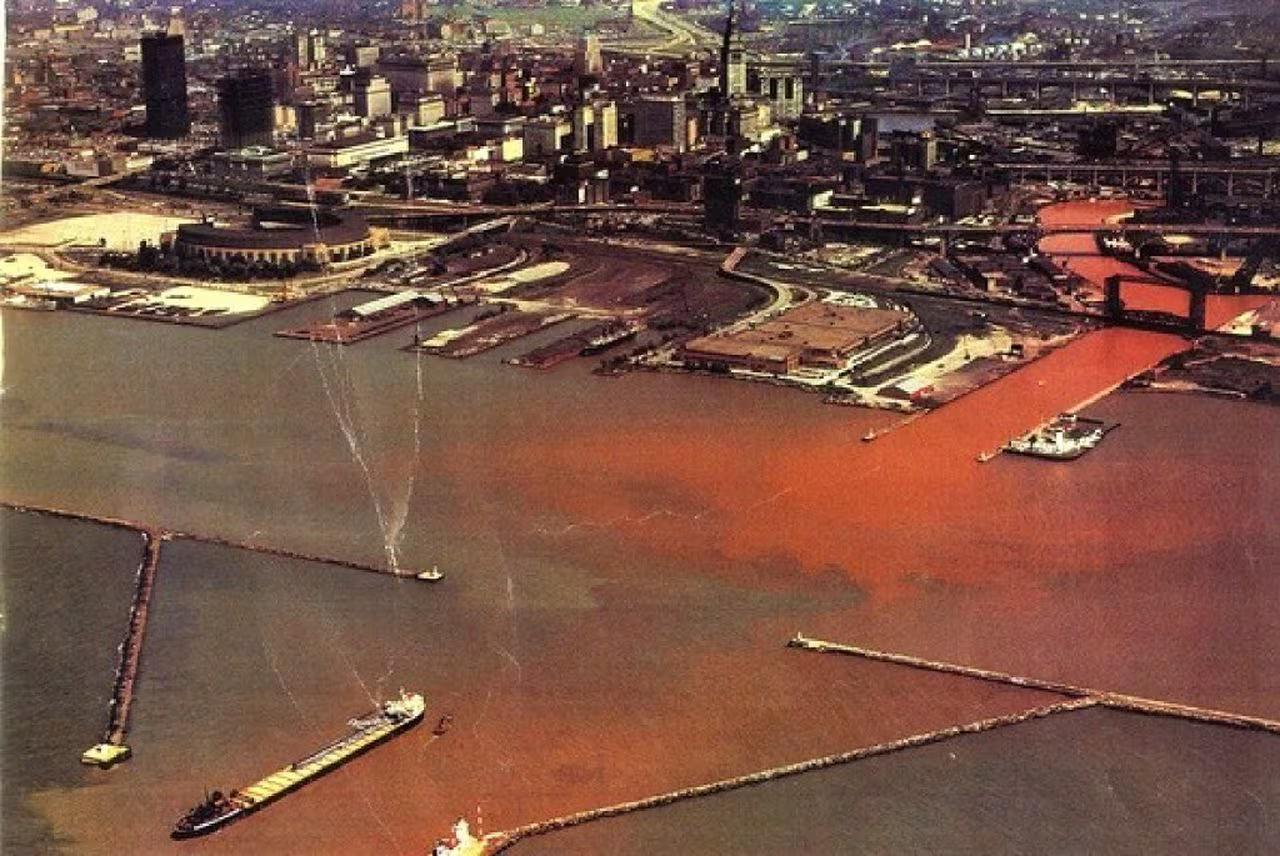
  1. Point of View The video Cuyahoga Rivers focusing on the way people have worked to heal it after years of neglect. It really paints a picture of how something that was once an environmental disaster became a success story. The way that they tell it, the river’s awful state is due to pollution and because of industrial waste that then sparked the changes that had to happen in the U.S. to solve these issues. The film highlights how both public opinion and government policy started shifting after the river's repeated pollution incidents, especially the famous 1969 fire.   2. Purpose   The video was made to display just how important the Cuyahoga River fire was when it came to the policies involving the environmental issues we now have in the present. It shows that the fire that happened in 1962 was a turning point,   hat then lead to big changes like the Clean Water Act that took place in 1972. More than just a history lesson, it’s a reminder that real e...

blog 1

  What I Most Look Forward to in My Environmental Science Class is able to increase my knowledge when it comes to learning about ecology as that is a strong fascination of mine. What I Think This Class Will Be About I think this class will provide me a basic intro into environmental science and build a base structure of knowledge for me to further my education.